## Data Science context
- Dataset: n points in a d-dimensional space:
- essentially, a $n \times d$ matrix of floats
- For $d > 3$ and growing, several practical problems
## 1-hot encodings raise dimensionality
## How to see dimensions
data points are row vectors
|
X1 |
X2 |
... |
Xd |
| x1 |
x11 |
x12 |
... |
x1d |
| ... |
... |
... |
... |
... |
| xn |
xn1 |
xn2 |
... |
xnd |
## Issues
- visualization is hard, we need projection. Which?
- decision-making is impaired by the need of chosing which dimensions to operate on
- __sensitivity analyis__ or causal analysis: which dimension affects others?
# Issues with High-Dim. data
## I: a false sense of sparsity
adding dimensions makes points seems further apart:
| Name |
Type |
Degrees |
| Chianti |
Red |
12.5 |
| Grenache |
Rose |
12 |
| Bordeaux |
Red |
12.5 |
| Cannonau |
Red |
13.5 |
d(Chianti, Bordeaux) = 0
-----
let type differences count for 1:
d(red, rose) = 1
take the alcohol strengh as integer tenths-of-degree: d(12, 12.5) = 5
. . .
d(Chianti, Grenache) = $\sqrt{ 1^2 + 5^2} =5.1$
Adding further dimensions make points seem further from each other
## not close anymore?
| Name |
Type |
Degrees |
Grape |
Year |
| Chianti |
Red |
12.5 |
Sangiovese |
2016 |
| Grenache |
Rose |
12 |
Grenache |
2011 |
| Bordeaux |
Red |
12.5 |
|
2009 |
| Cannonau |
Red |
13.5 |
Grenache |
2015 |
d(Chianti, Bordeaux) > 7
d(Chianti, Grenache) > $\sqrt{5^2 + 1^2 + 5^2} =7.14$
## II: the collapsing on the surface
Bodies have most of their mass distributed close to the surface (even under uniform density)
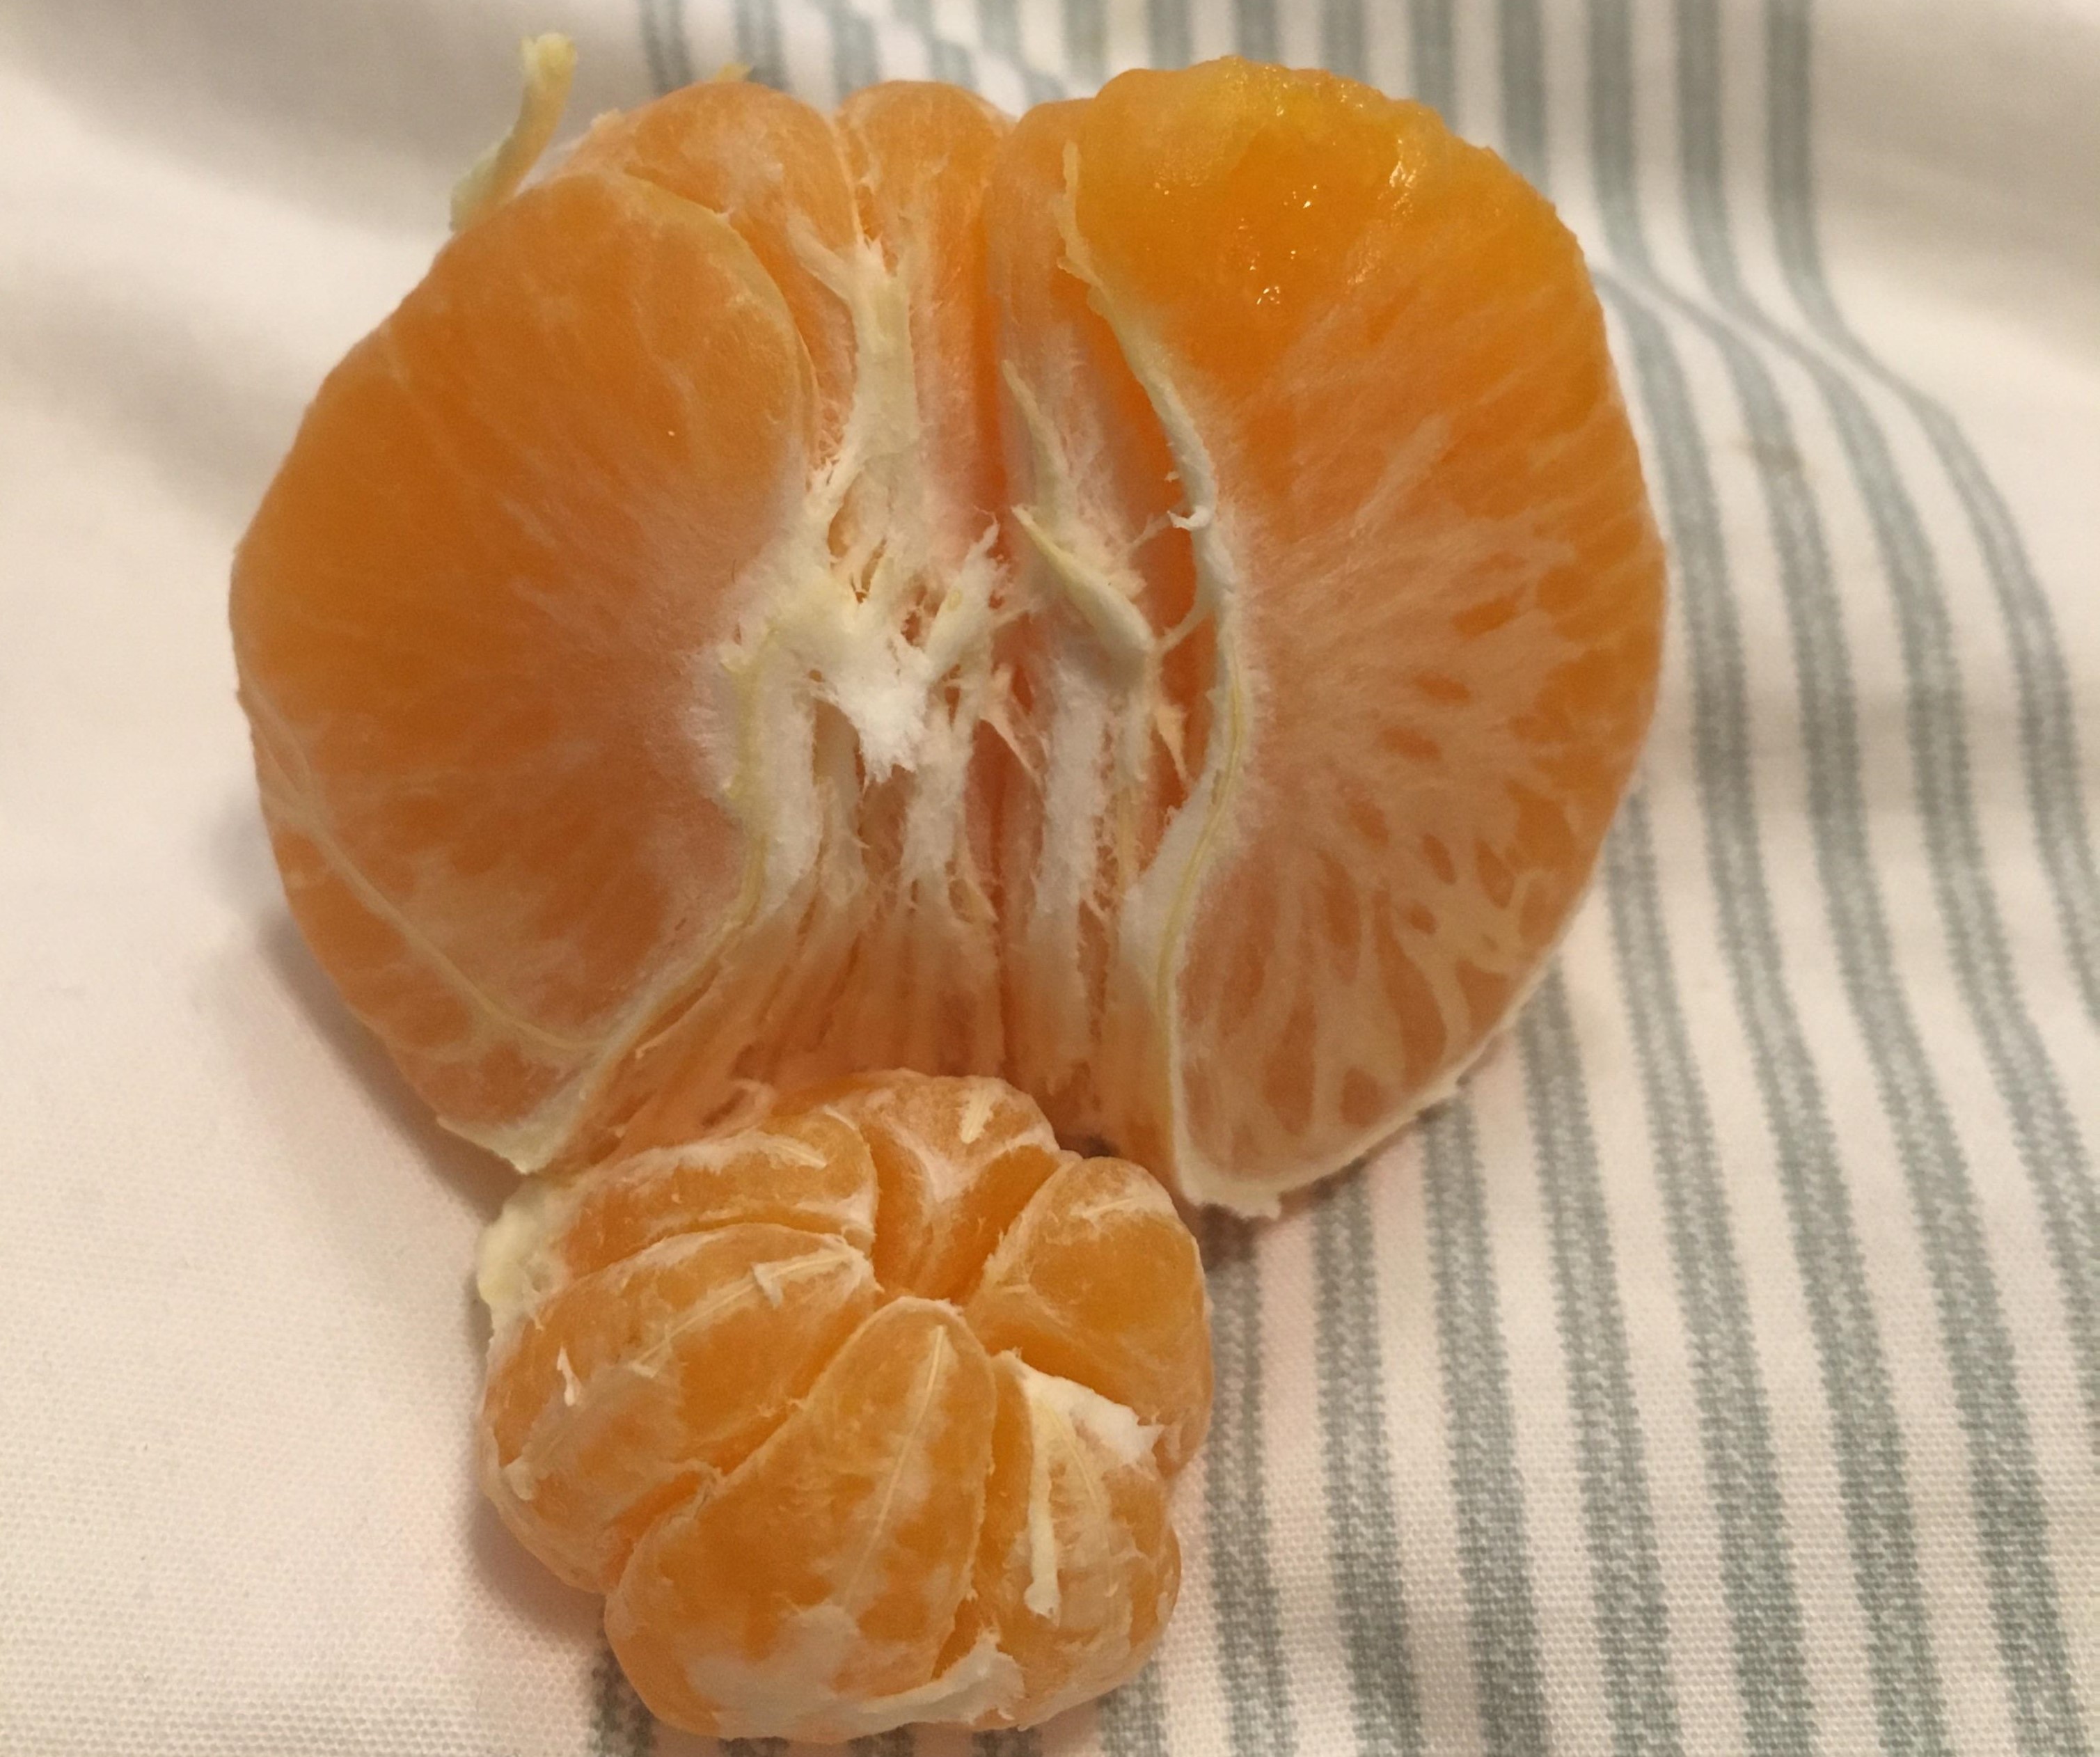
the *outer* orange is twice as big, but how much more juice will it give?
-----

- for d=3, $vol= \frac{4}{3}\pi r^3$.
- With 50% radius, vol. is only $\frac{1}{8}=12.5\%$
## Possibly misguiding
The most volume (and thus weight) is in the external ring (the equators)
## counter-intuitive properties
At a fixed radius (r=1), raising dimensionality *above 5* in fact [decreases the volume](https://upload.wikimedia.org/wikipedia/commons/6/6c/Hypersphere_volume_and_surface_area_graphs.svg).
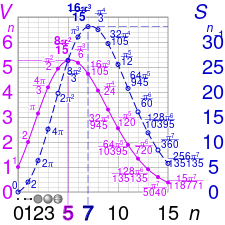
Hyperballs deflate.
Geometry is not what we experienced in $d\leq 3.$
## [The Curse of dimensionality](https://en.wikipedia.org/wiki/Curse_of_dimensionality)
Volume will concentrate near the surface: most points will look as if they are at a uniform distance from each other
- distance-based similarity fails
# Consequences
## Adding dimensions apparently increases sparsity
Deceiving as a chance to get a clean-cut segmentation of the data, as we did with Iris
. . .
In high dimension, all points tend to be at the same distance from each other
Exp: generate a set of random points in $D^n$, compute Frobenius norms: very little variance.
. . .
bye bye clustering algorithms, e.g., k-NN.
-----
## The porcupine
At high dimensions,
- all diagonals strangely become orthogonal to the axes
- points distributed along a diagonal gets *``compressed down''* to the origin of axes.
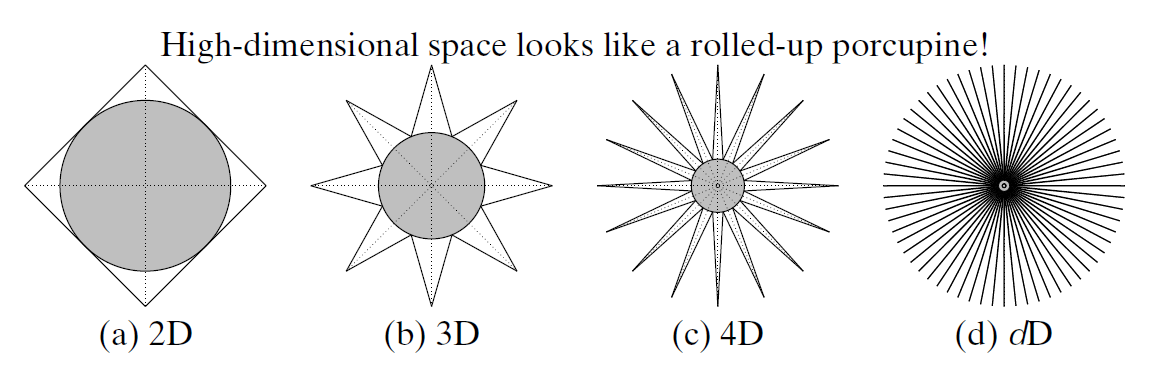
. . .
bye bye to all distance-based algorithms and similarity measures, e.g., Cosine Similarity.
## Where are all my data points?
