k-NN
From the introduction:
- (was 1) Classification and class probability
Instance:
a collection (dataset) of datapoints from \(\mathbf{X}\)
a classification system \(C = \{c_1, c_2, \dots c_r\}\)
Solution: classification function \(\gamma: \mathbf{X} \rightarrow C\)
Measure: misclassification
Binary classification
\(r=2\): positive and negative.
Misclassification is described by the confusion matrix, which scores the result of classification against labeled examples.

Often one class is of more interest than the other: better measures are needed.
Binary classification in 2D
With just two numerical dimensions, datapoint similarity can be interpreted as simple Euclideian distance.
Being very close \(\Longleftrightarrow\) being very similar.
Are 4 and 6 more similar to each other than -1 and +1?
Assumption: small changes in the values won’t alter the classification, close points will receive the same classification.
if close distance then assing same class
The nearest neigh.
Take a set of labeled points (the examples), all others are blank at the moment.
Whenever a blank point has a nearest neighbor datapoint which is labeled, give it the same label
This is the NN, or 1-NN algorithm.
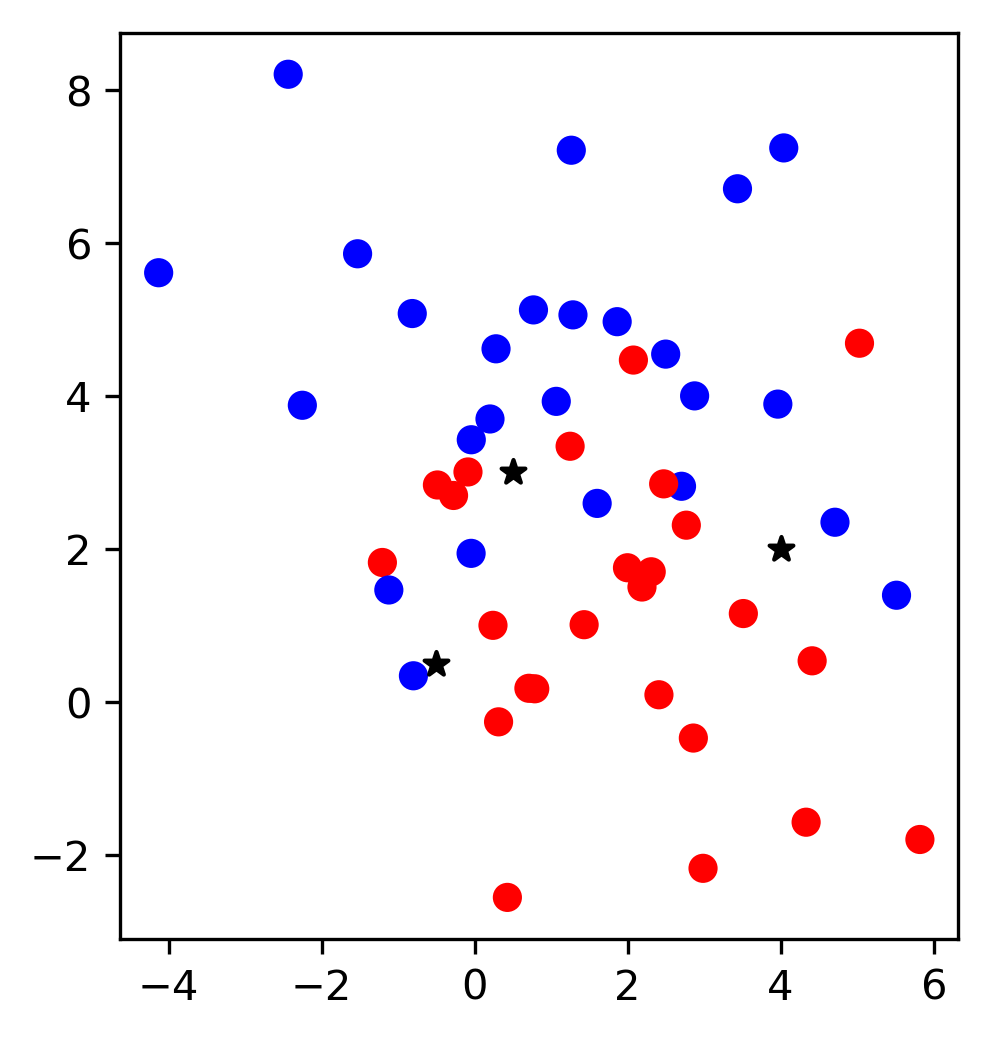
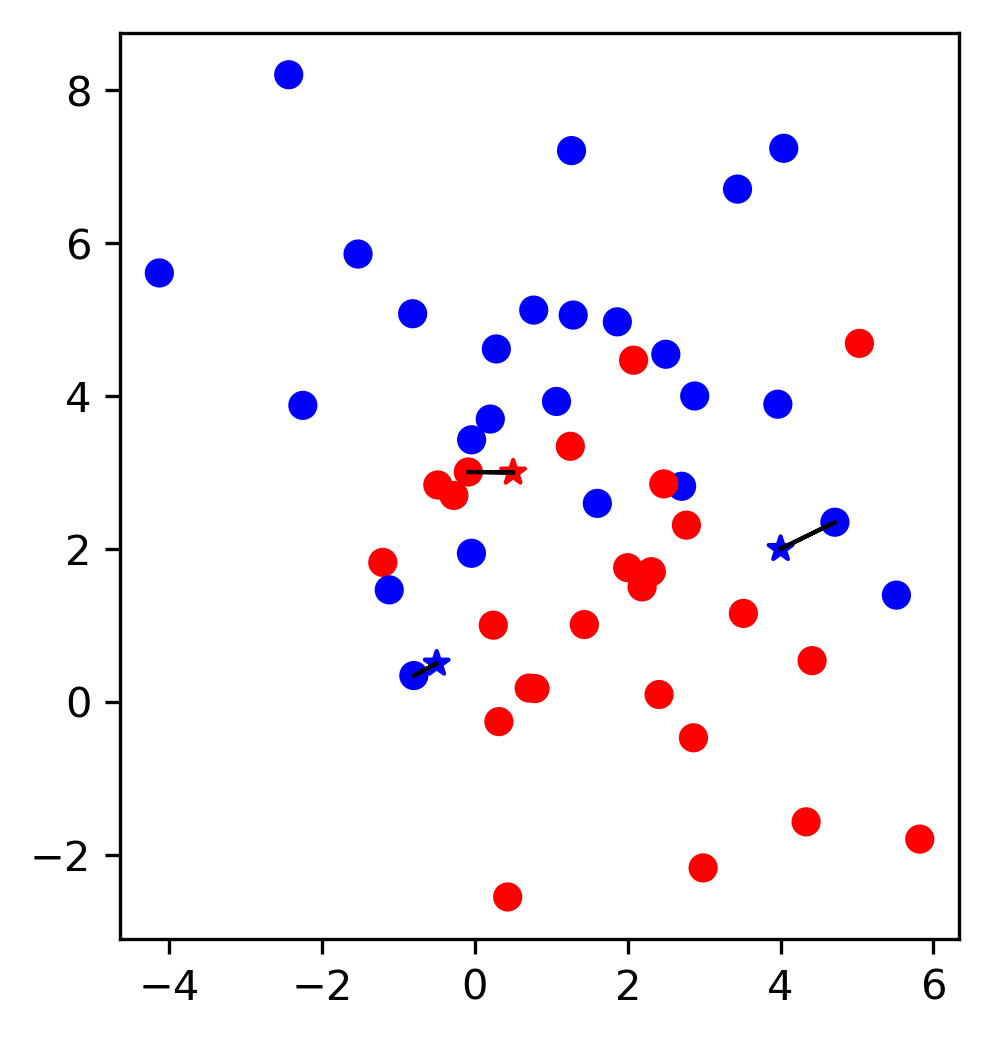
\[\gamma(\mathbf{x}) = y_i, i = \text{argmin}_j ||\mathbf{x}_j - \mathbf{x}||\]
From 1-NN to k-NN
Consider the k nearest neighbors
Assign the class that is the most common among them
Variation: consider each label relative to the effective distance of the neighbor.
1-NN

3-NN
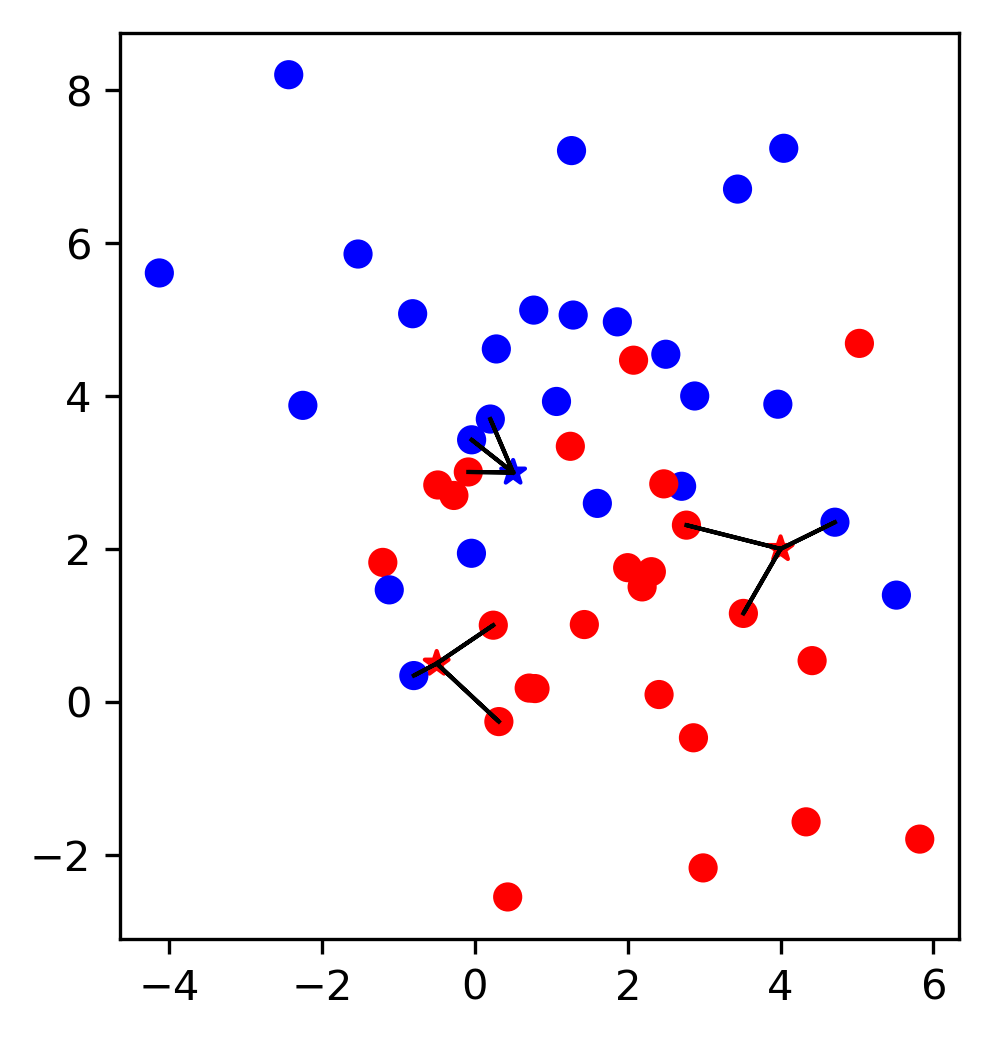
Learning
Given the labeled examples, k-NN determines the areas around each example which give a certain class.
k-NN learns an area or surface and applies it in classification
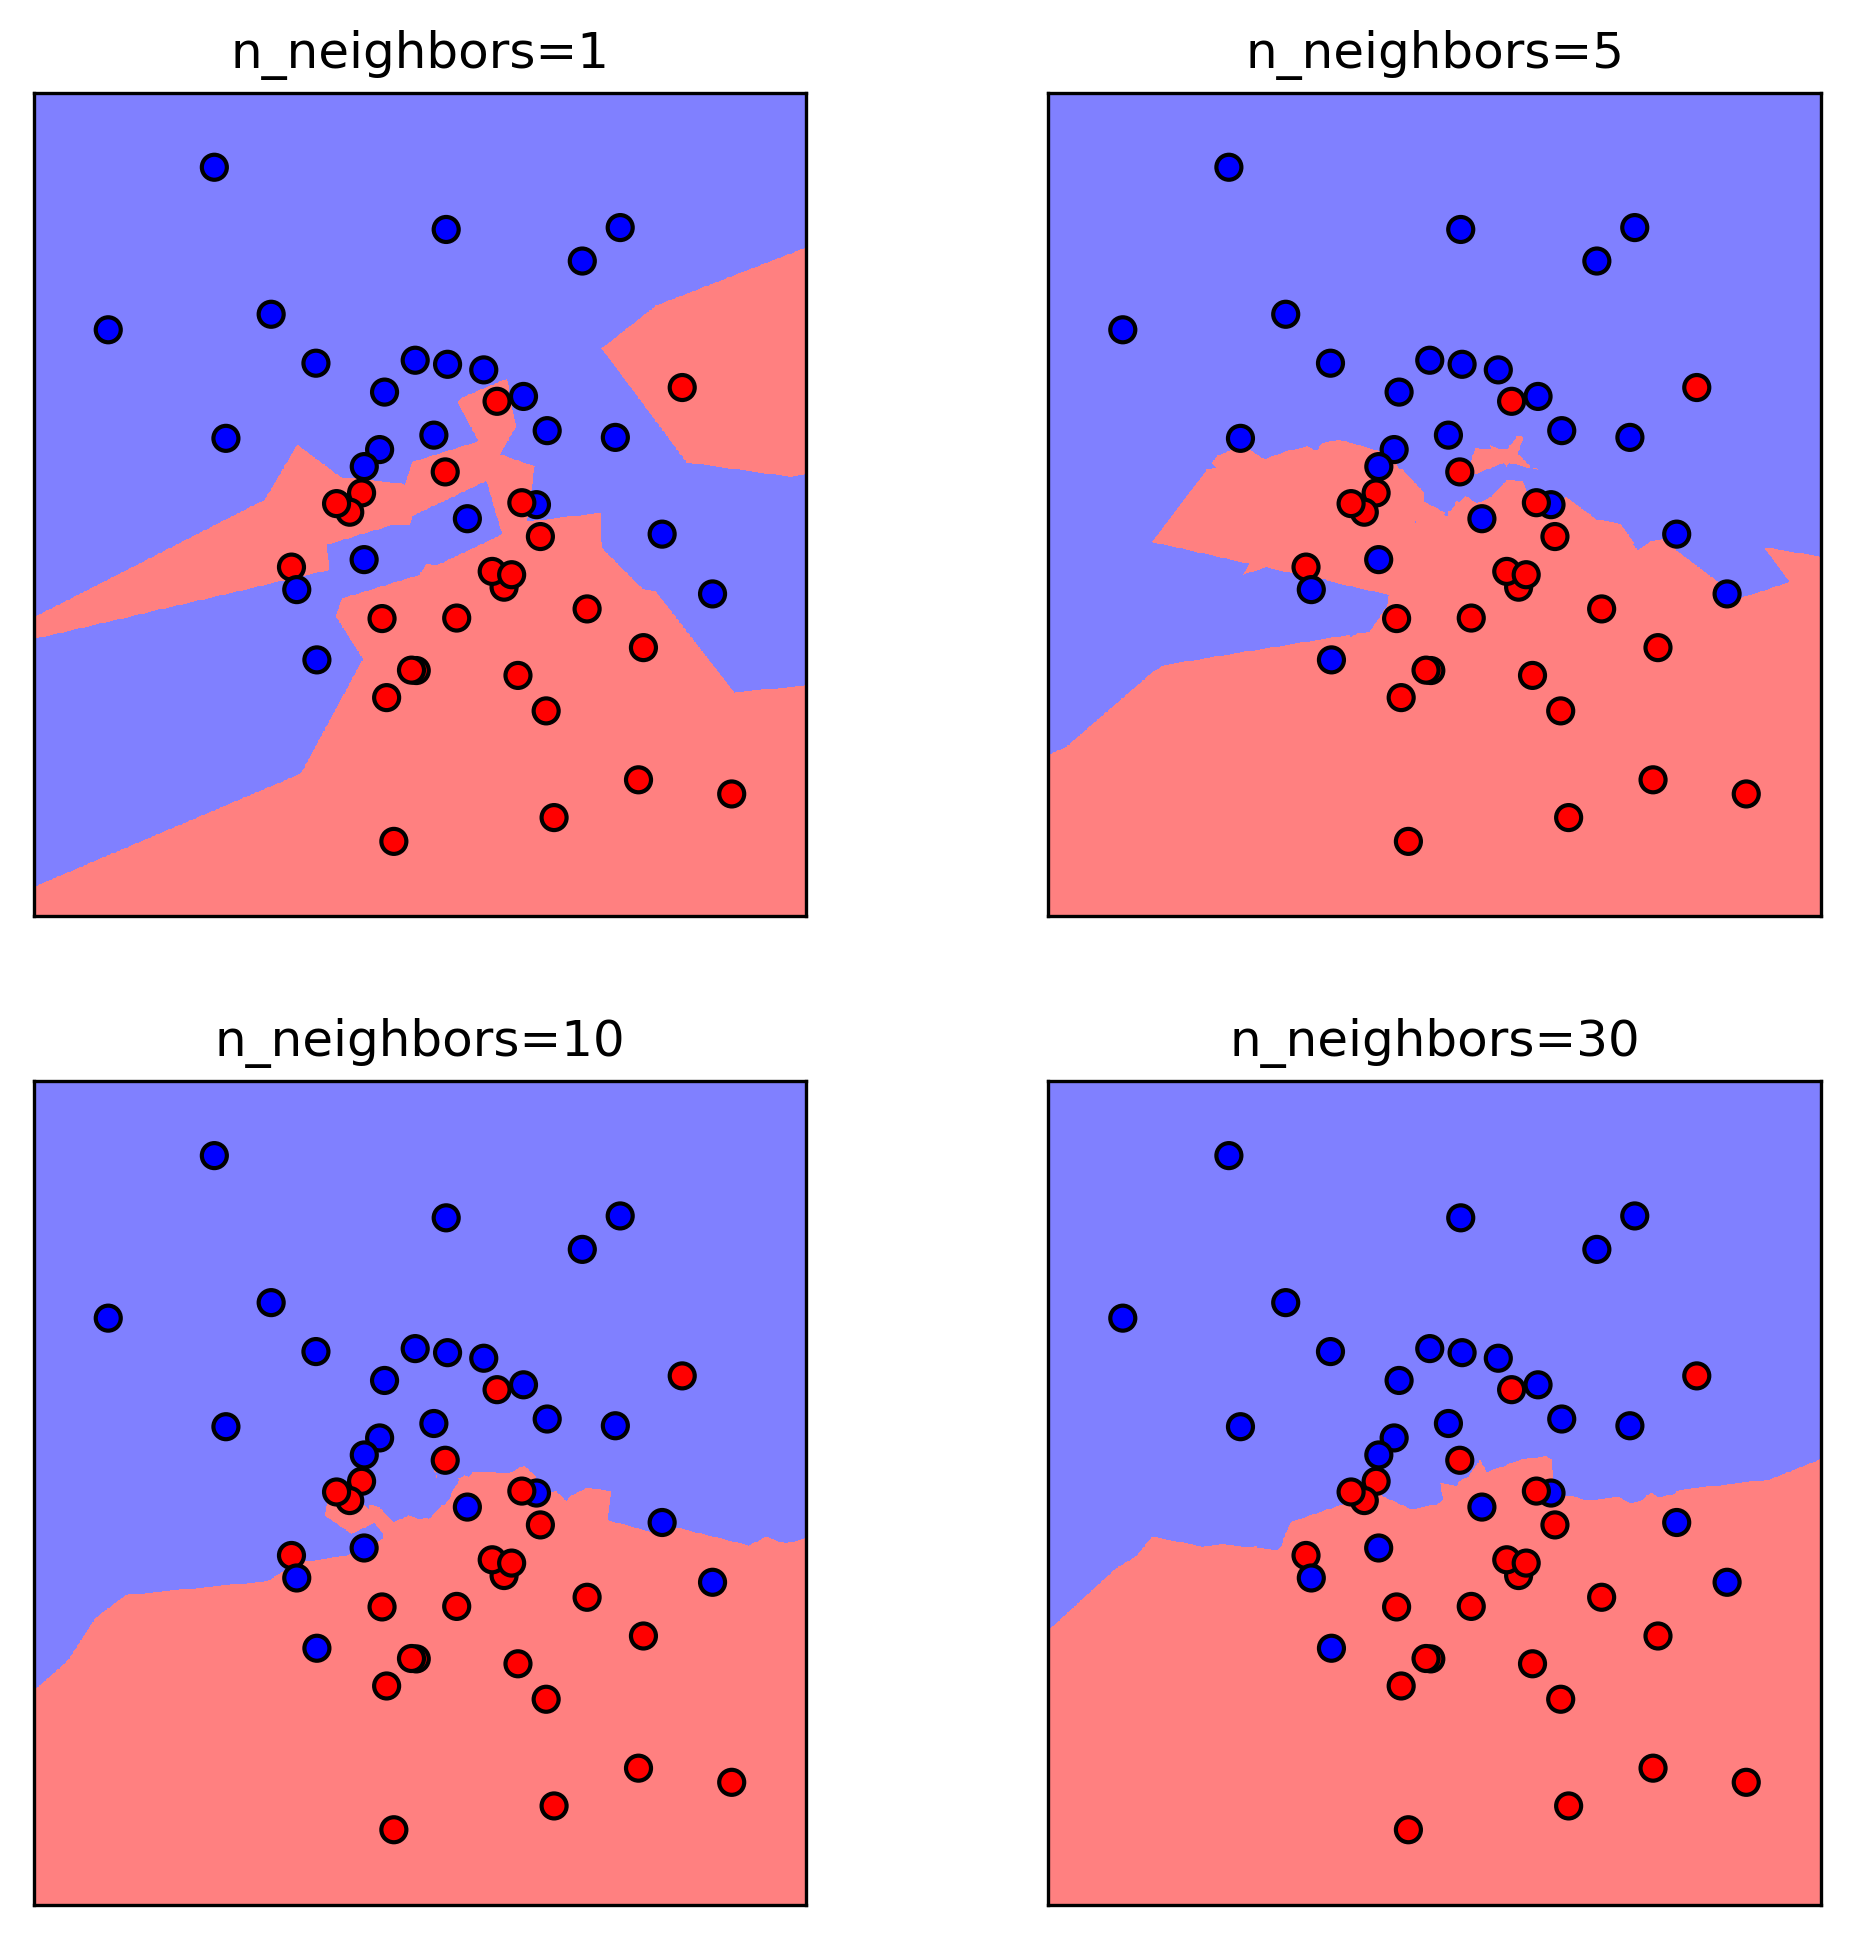
A larger k does not always mean a better classification
Influence of k
Observations
k-NN
introduces us to voting systems
is effective when the two classes are balanced, i.e., not skewed, in the dataset
there is no standard way to choose k, yet it may greatly influence the outcome:
- we face hyperparameter optimization.
on large training datasets, even 1-NN approaches the irreducible_error_rate (2x).
Trade-offs
Sometime improving accuracy on the training data does not translate into improved accuracy in testing against unseen data
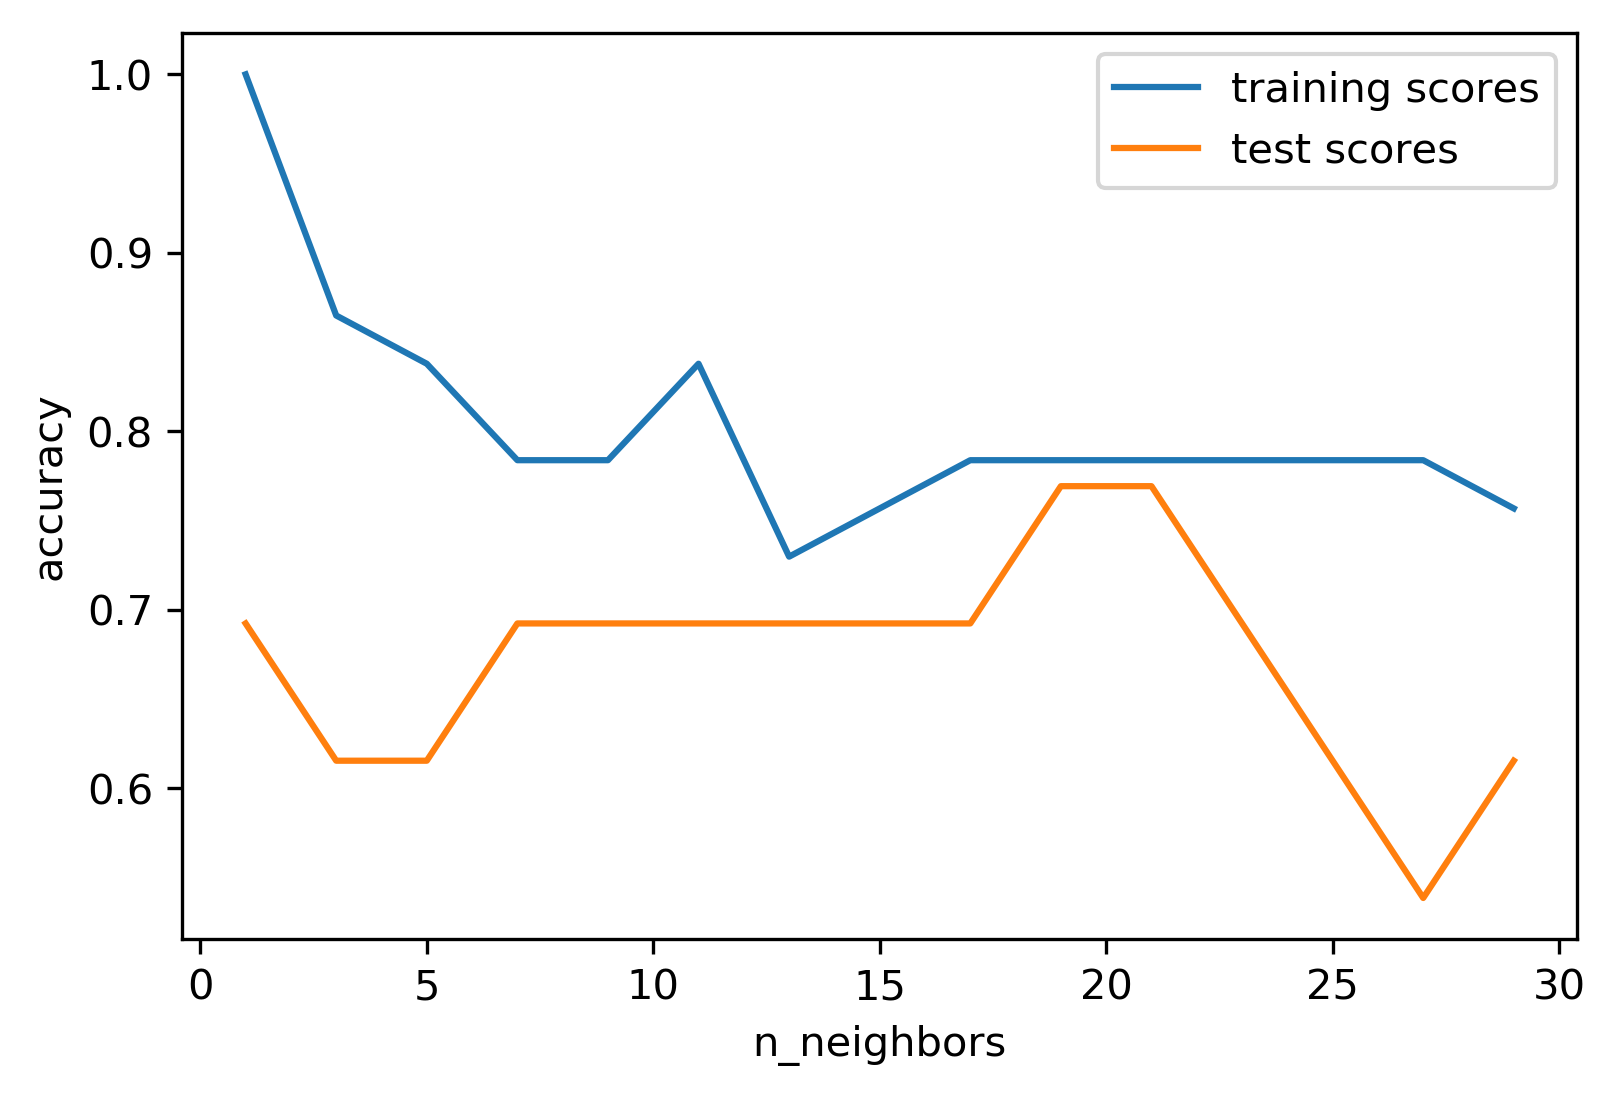
1-NN is perfect on training but 0.7 on test.
Higher k’s do not improve much and overfitting creeps in.